

Beneath the surface of stable employment lies a hidden pattern of instability: for most workers, earnings vary substantially from month to month, even within continuing employment relationships. This volatility is unequally distributed. Hourly workers—who tend to be lower income and more financially fragile—face much more volatility than salaried, higher-income workers. These fluctuations are in turn economically meaningful—shaping spending behavior, job mobility, and the lived experience of work for the 60 percent of the U.S. workforce that is paid hourly.
The authors use comprehensive administrative data from workers (via paycheck deposits into Chase bank accounts) and firms (via a payroll processor) to document considerable monthly fluctuation in earnings. An analysis of these data reveals that monthly earnings volatility is substantial. In about three-quarters of months, workers receive a different amount of pay than they received the prior month. The median month has a change of 5 percent, and in one quarter of months the change in pay is at least 17 percent.
This volatility is concentrated among hourly workers. Figure 1 illustrates this heterogeneity in earnings volatility between salaried and hourly workers. As shown in the figure, for the majority of months, there is no change in earnings for salaried workers. In contrast, for hourly workers, no change in monthly earnings is a rare outcome.
To get a sense of what this looks like in real life, Figure 2 shows pay volatility for a few typical hourly and salaried workers in their first year of employment. In the top panel, the hourly workers show large and sometimes persistent swings in earnings from month to month. In more than one-quarter of months, workers’ earnings are at least 17% different from their average monthly earnings. What is the prime culprit? The researchers find it to be fluctuation in hours worked. In contrast, the bottom panel shows that salaried workers’ earnings are more stable; they usually have a large dip or spike in only one month out of the year. The researchers show in the paper that salaried workers are much more likely to have spikes in pay than dips in pay and further that the one-month spikes for salaried workers are usually due to bonuses and commissions.
These findings raise two important questions: Why do hours move from month to month? And does this instability matter for worker welfare?
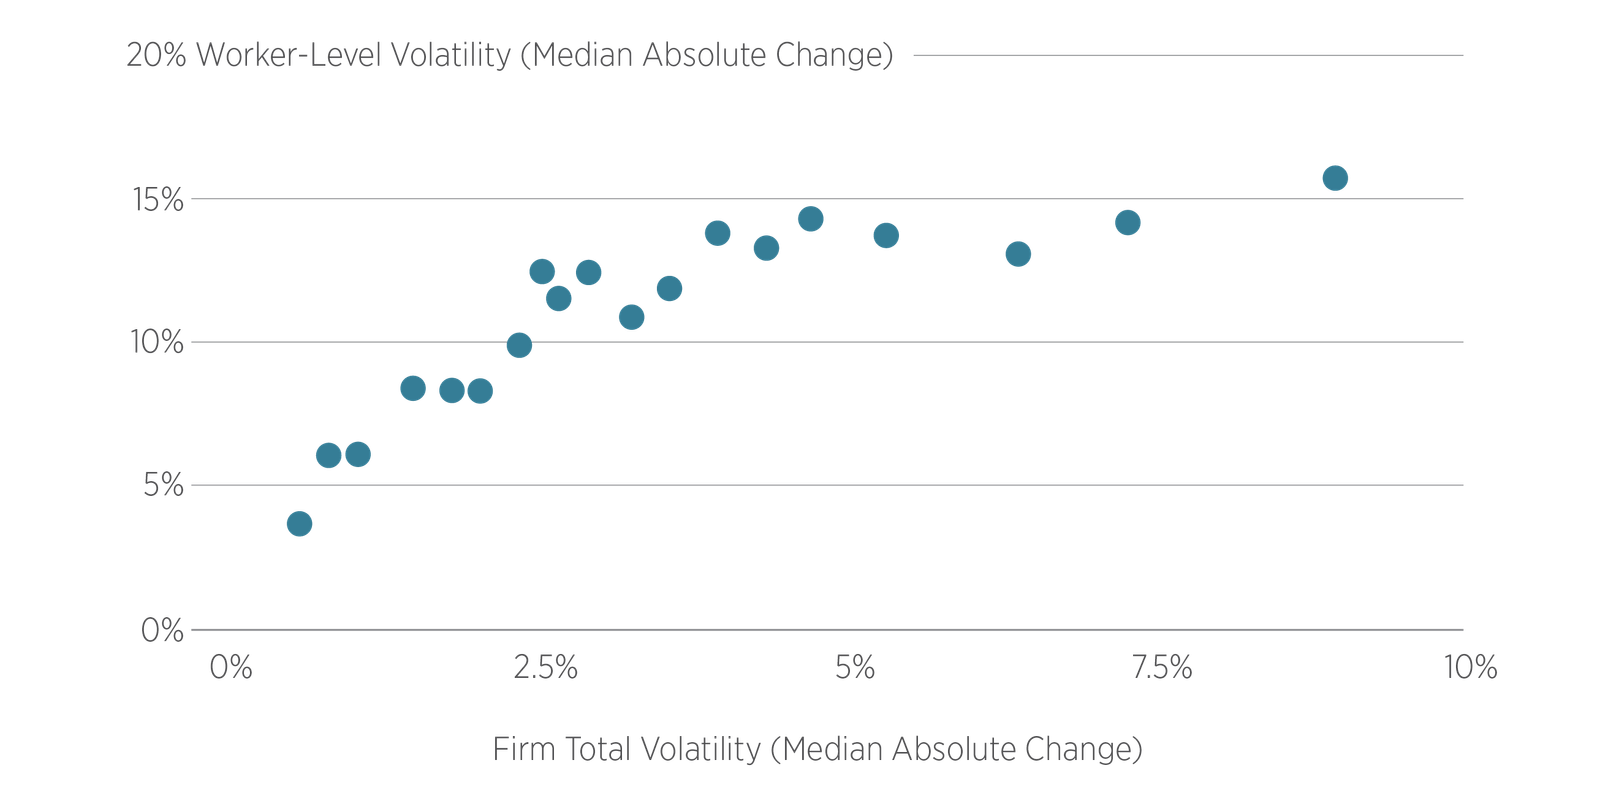
The authors find evidence that worker-related determinants like temporary unpaid leave, childcare demands, and seasonal fluctuations are not explanatory; rather, firms are the key to explaining changes in worker hours. Consequently, a meaningful share of this instability is imposed on the worker and is outside their control. The relationship between the volatility of the firm’s demand for labor—measured as the change in total firm hours—and the volatility of worker pay is shown in Figure 3. As the figure shows, there is a positive relationship between firm labor demand volatility and worker pay volatility; in other words, larger changes in the total amount of hours worked by all employees is associated with larger changes in individual worker pay.
The authors show this instability affects workers’ wellbeing in two ways:
Given that the above volatility is costly to workers, the authors ask a question fundamental to economic thinking: How much would workers pay to avoid earnings volatility? The answer is that the median hourly worker would forgo 4–11% of their income to attain the more stable income of a median salaried worker. Lower-income workers, who face the highest volatility, would trade an even higher fraction of their earnings for the stability of a salaried position.
Bottom line: Workers face substantial monthly earnings risk that, to this point, has been missed when analyzing annual data. This risk is borne primarily by relatively low income, hourly workers, and is largely driven by fluctuations in firms’ labor demand which induces substantial costs on affected workers. This paper reveals that these earnings fluctuations represent genuine, welfare-relevant risk that materially shapes household decisions and has attendant effects on the economy.

