Local Economies, Global Perspective

Methodology

This project combines high-resolution spatial data and machine learning, using Random Forest models trained on diverse predictors like population, nighttime lights, land use, CO2 emissions, and vegetation indices, to estimate local GDP shares globally while addressing data scarcity and cross-regional variability​.

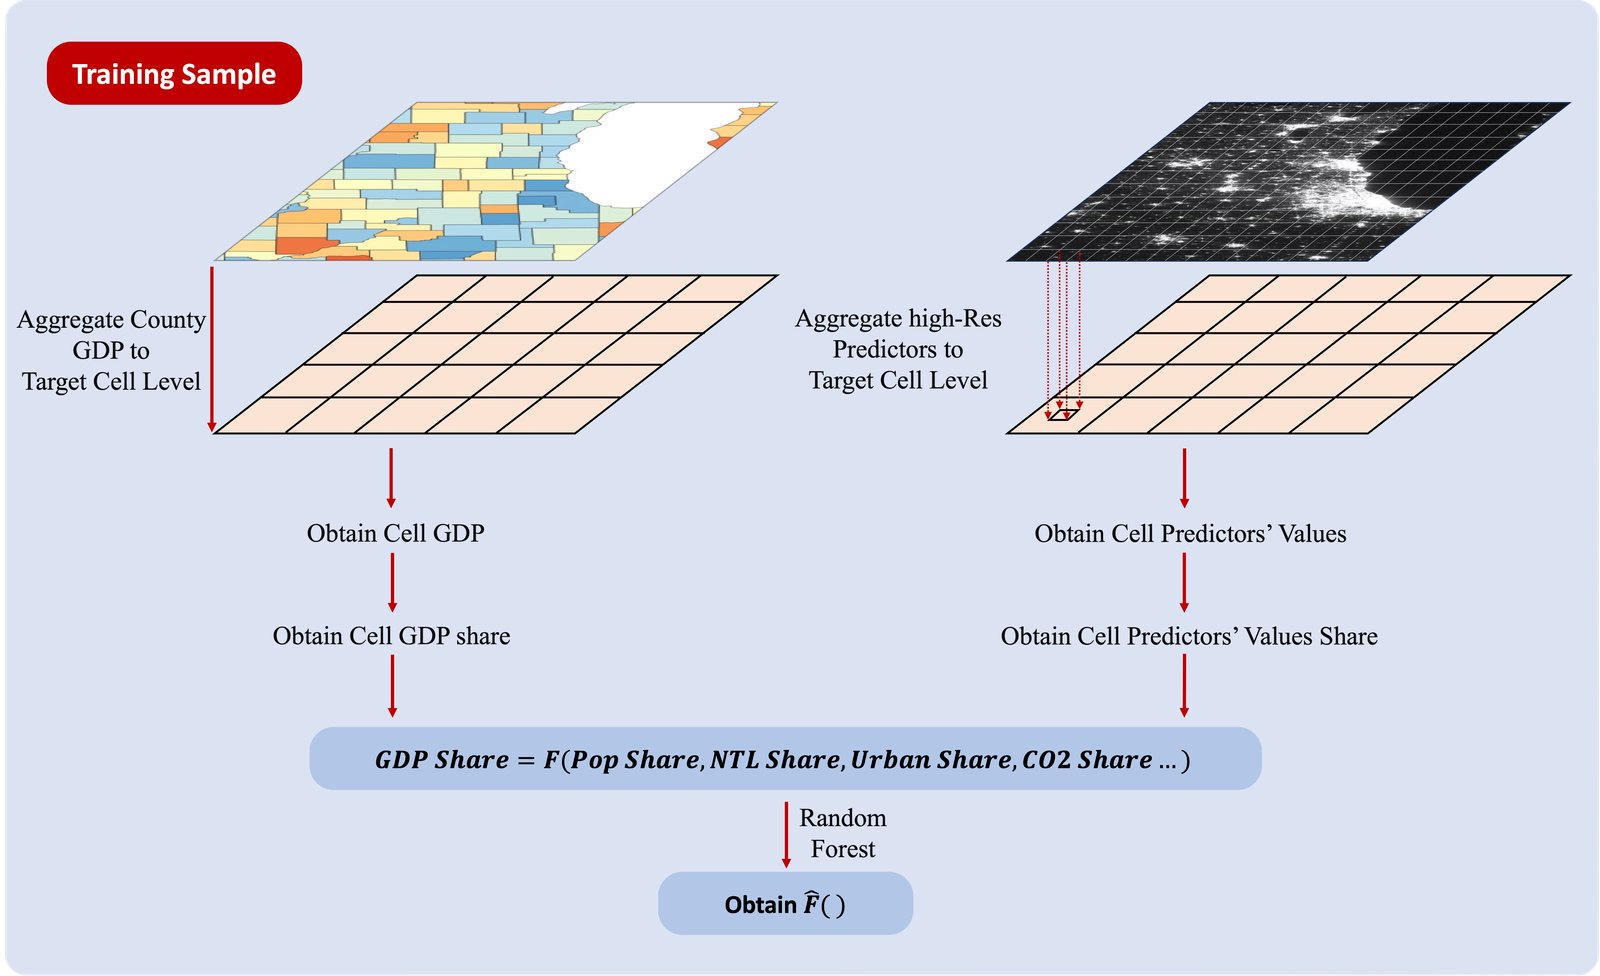
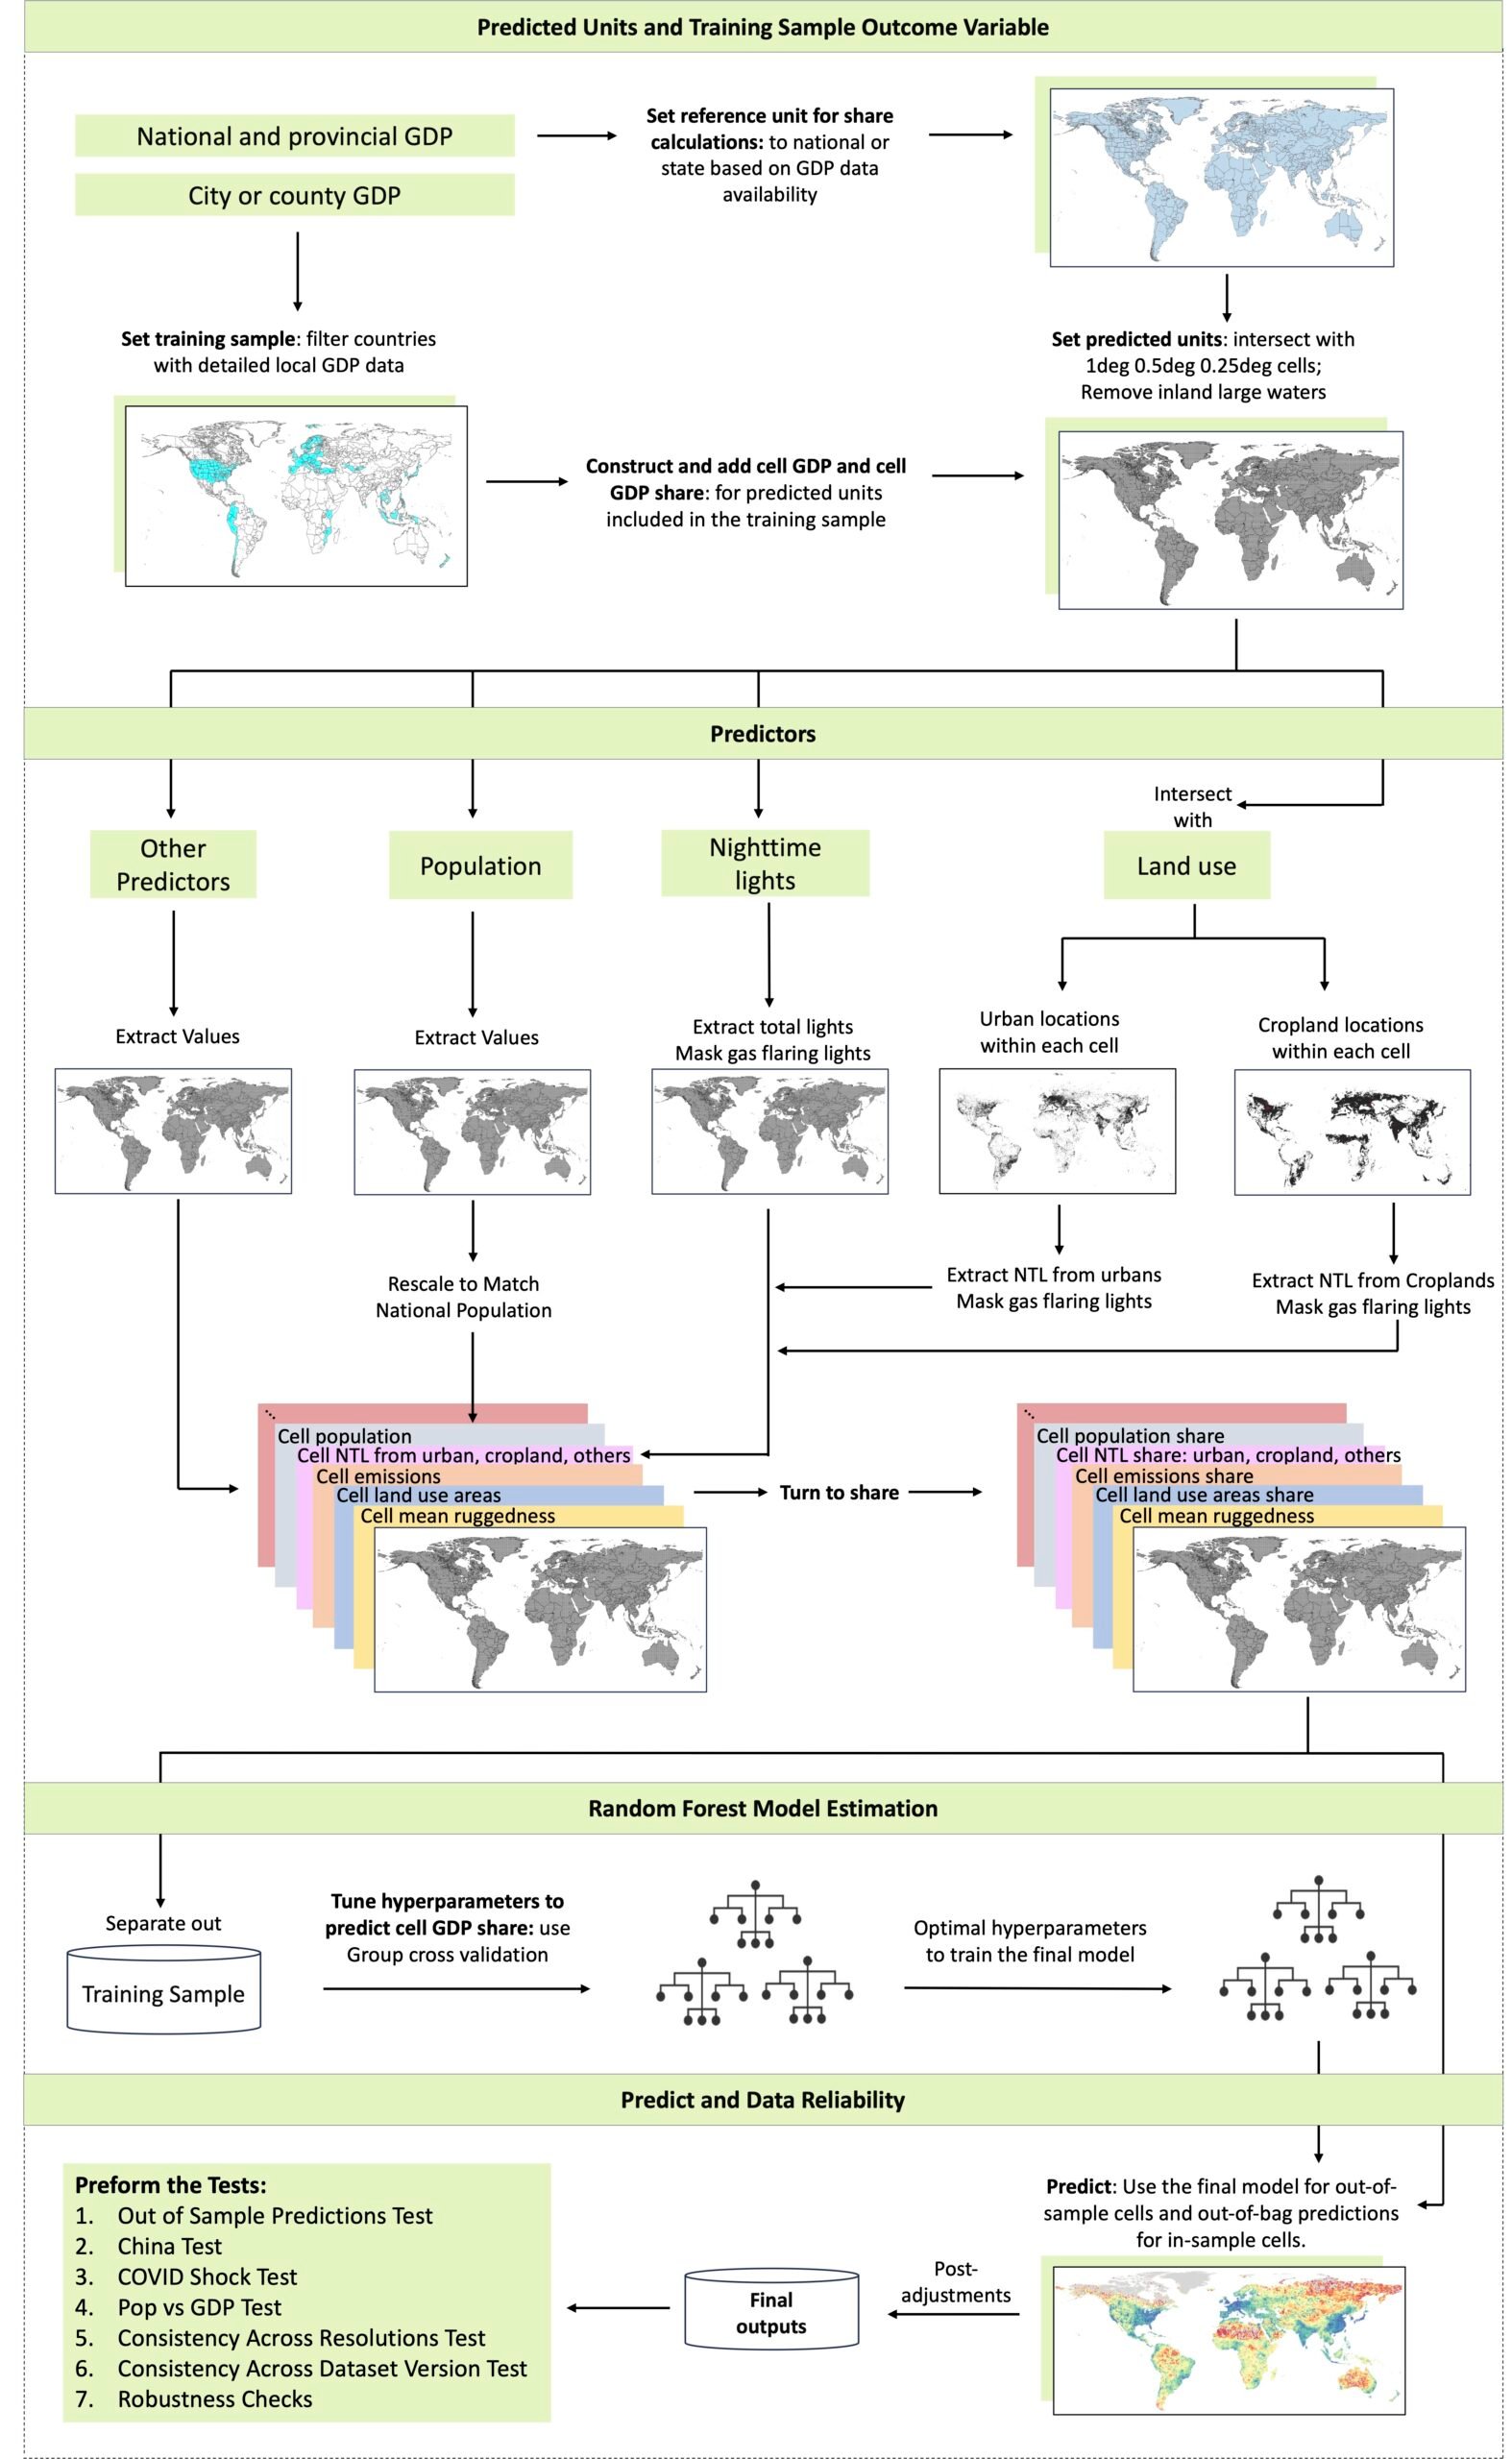
This study aims to develop random forest models using high-resolution data to predict the spatial distribution of local GDP. The target variable is cell GDP share, defined as the proportion of GDP attributed to a specific cell relative to its higher administrative unit (e.g., province, state, or country). Predictor variables are also expressed as shares, including cell population, vegetation, nighttime light emissions, urban areas, cropland, forest, water, snow & ice, ruggedness, national GDP per capita, and CO₂ emissions from manufacturing, heavy industry, and transportation.

Training data spans countries across North America, South America, Europe, Africa, and Asia. The model is trained to capture the relationship between predictor shares and cell GDP shares, and is applied globally to estimate local cell GDP shares.

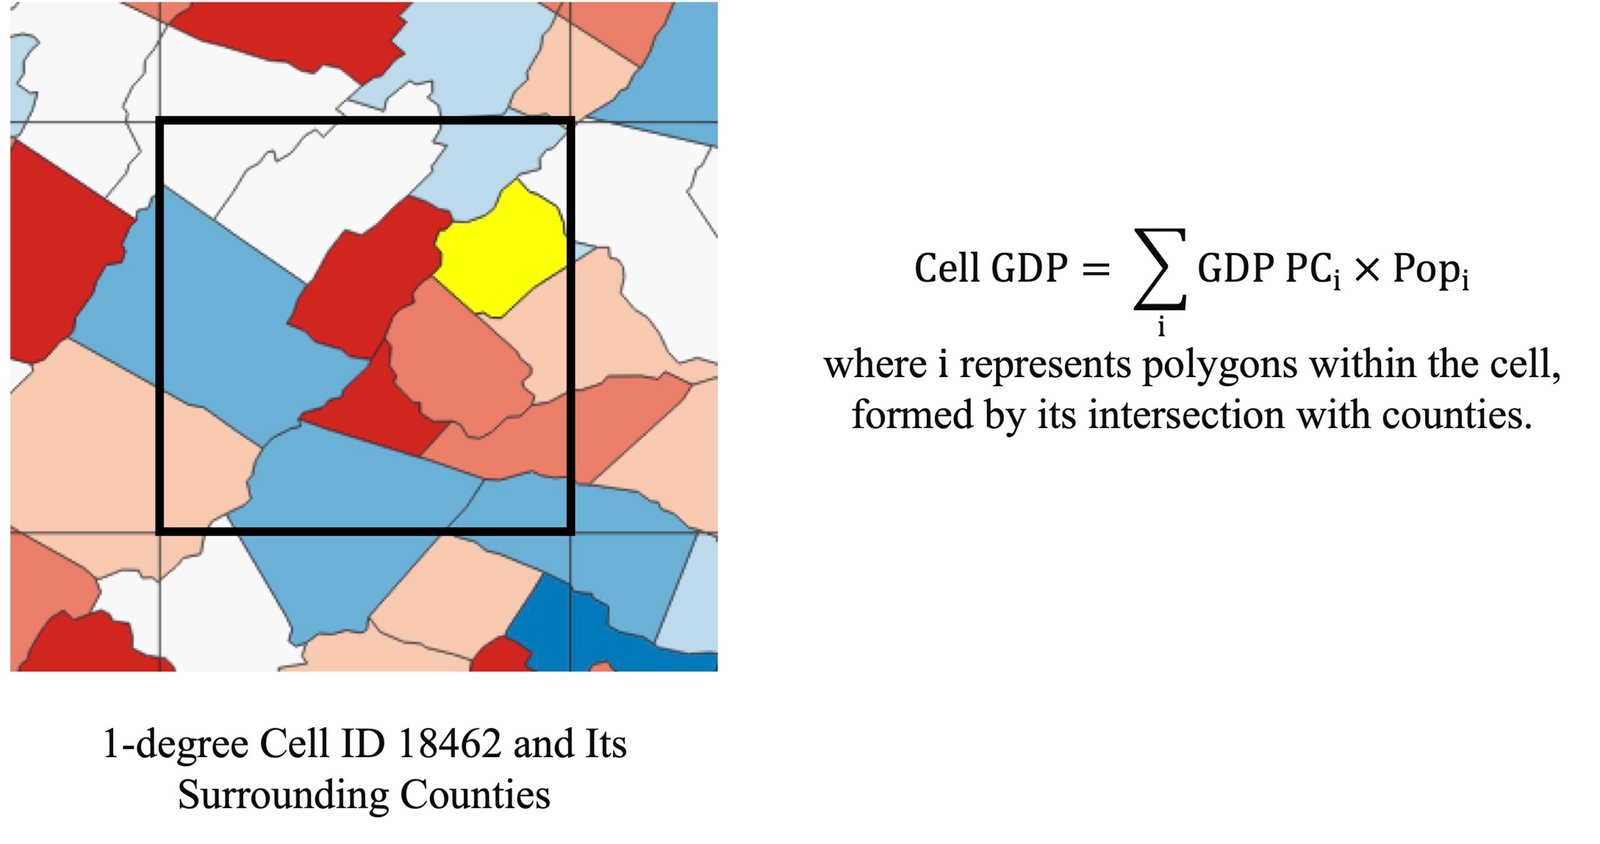
Refer to the following and our paper for detailed information on the construction of cell GDP for training data and a series of workflow:

ADDITIONAL RESOURCES

Download our step-by-step guide to replicate our estimates.

REPLICATION GUIDE PDF

CITATION

Rossi-Hansberg, Esteban and Jialing Zhang. 2025. “Local GDP Estimates Around the World.” BFI Working Paper No. 2025-17.

BIBTEX

Download the Data

Each ZIP file on the right contains a folder with a shapefile for the specified grid cell resolution and four CSV files. One CSV includes estimates of predicted GDP where estimates are suppressed for grid cells with population densities of 0 (the main approach used in the paper). The other three CSVs provide estimates where the suppression thresholds are set to 0.01, 0.02, or 0.05 individuals per km² of cell land area.

Data Definitions

PDF

1 Degree x 1 Degree

Estimates and shapefiles for 1-degree by 1-degree grid cells

ZIP

0.5 Degree x 0.5 Degree

Estimates and shapefiles for 0.5-degree by 0.5-degree grid cells

ZIP

0.25 Degree x 0.25 Degree

Estimates and shapefiles for 0.25-degree by 0.25-degree grid cells

ZIP

Release Notes
January 22, 2025

This initial release of the dataset includes data spanning 2012 to 2021. Updates will be made annually, with previous versions remaining accessible. For questions, feedback, or additional information, please contact us at: bfiglobalgdp@uchicago.edu.

How to Use the Map

Click on an area on the map to explore estimates of GDP.

Switch to different years or divide the map into finer geographies using the legend on the left.​

Explore this website to read the research, download the data, or contact us.

Additional Resources